These data have been superseded. Please see our latest releases for current estimates and contact information.
The U.S. Census Bureau and the U.S. Bureau of Economic Analysis announced today that the goods and services deficit was $73.1 billion in June, down $1.9 billion from $75.0 billion in May, revised.
Next release: Wednesday, September 4, 2024
(°) Statistical significance is not applicable or not measurable. Data adjusted for seasonality but not price changes
Source: U.S. Census Bureau, U.S. Bureau of Economic Analysis; U.S. International Trade in Goods and Services, August 6, 2024
Exports, Imports, and Balance (exhibit 1)
June exports were $265.9 billion, $3.9 billion more than May exports. June imports were $339.0 billion, $2.0 billion more than May imports.
The June decrease in the goods and services deficit reflected a decrease in the goods deficit of $2.5 billion to $97.4 billion and a decrease in the services surplus of $0.6 billion to $24.2 billion.
Year-to-date, the goods and services deficit increased $22.7 billion, or 5.6 percent, from the same period in 2023. Exports increased $58.0 billion or 3.8 percent. Imports increased $80.7 billion or 4.2 percent.
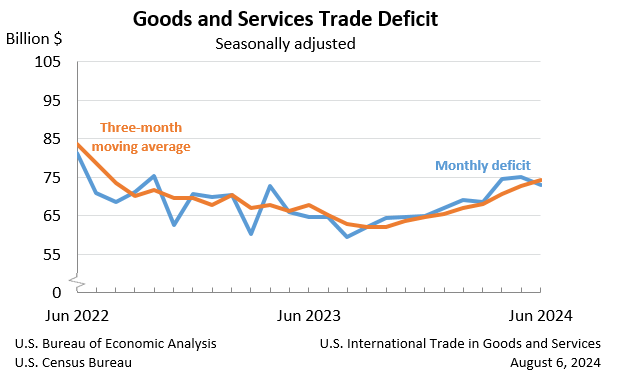
Three-Month Moving Averages (exhibit 2)
The average goods and services deficit increased $1.5 billion to $74.2 billion for the three months ending in June.
Year-over-year, the average goods and services deficit increased $6.3 billion from the three months ending in June 2023.
Exports (exhibits 3, 6, and 7)
Exports of goods increased $4.4 billion to $174.2 billion in June.
Exports of goods on a Census basis increased $4.6 billion.
Net balance of payments adjustments decreased $0.2 billion.
Exports of services decreased $0.4 billion to $91.7 billion in June.
Imports (exhibits 4, 6, and 8)
Imports of goods increased $1.9 billion to $271.6 billion in June.
Imports of goods on a Census basis increased $2.1 billion.
Net balance of payments adjustments decreased $0.2 billion.
Imports of services increased $0.2 billion to $67.5 billion in June.
Real Goods in 2017 Dollars – Census Basis (exhibit 11)
The real goods deficit decreased $2.5 billion, or 2.6 percent, to $91.4 billion in June, compared to a 2.5 percent decrease in the nominal deficit.
Revisions
Revisions to May exports
Revisions to May imports
Goods by Selected Countries and Areas: Monthly – Census Basis (exhibit 19)
The June figures show surpluses, in billions of dollars, with Netherlands ($4.8), South and Central America ($3.6), Hong Kong ($2.1), Australia ($1.9), United Kingdom ($0.9), Brazil ($0.8), Belgium ($0.7), and Saudi Arabia ($0.1). Deficits were recorded, in billions of dollars, with China ($22.3), European Union ($18.0), Mexico ($13.7), Vietnam ($10.9), Germany ($7.4), Taiwan ($6.4), Ireland ($5.8), South Korea ($5.7), Japan ($4.9), Canada ($4.6), India ($3.7), Italy ($3.1), Switzerland ($2.9), Malaysia ($1.8), France ($1.3), Israel ($0.9), and Singapore ($0.4).
All statistics referenced are seasonally adjusted; statistics are on a balance of payments basis unless otherwise specified. Additional statistics, including not seasonally adjusted statistics and details for goods on a Census basis, are available in exhibits 1-20b of this release. For information on data sources, definitions, and revision procedures, see the explanatory notes in this release. The full release can be found at www.census.gov/foreign-trade/Press-Release/current_press_release/index.html or www.bea.gov/data/intl-trade-investment/international-trade-goods-and-services. The full schedule is available in the Census Bureau’s Economic Briefing Room at www.census.gov/economic-indicators/ or on BEA’s website at www.bea.gov/news/schedule.
Next release: September 4, 2024, at 8:30 a.m. EDT
U.S. International Trade in Goods and Services, July 2024
Explanatory Notes
Goods (Census basis)
Data for goods on a Census basis are compiled from the documents collected by U.S. Customs and Border Protection (CBP) and reflect the movement of goods between foreign countries and the 50 states, the District of Columbia, Puerto Rico, the U.S. Virgin Islands, and U.S. Foreign Trade Zones. They include government and non-government shipments of goods and exclude shipments between the United States and its territories and possessions; transactions with U.S. military, diplomatic, and consular installations abroad; U.S. goods returned to the United States by its Armed Forces; personal and household effects of travelers; and in-transit shipments. The General Imports value reflects the total arrival of merchandise from foreign countries that immediately enters consumption channels, warehouses, or Foreign Trade Zones.
For imports, the value reported is the CBP-appraised value of merchandise—generally, the price paid for merchandise for export to the United States. Import duties, freight, insurance, and other charges incurred in bringing merchandise to the United States are excluded. The exception is exhibit 17a, which shows CIF import value. The CIF (cost, insurance, and freight) value represents the landed value of the merchandise at the first port of arrival in the United States. It is computed by adding import charges to the customs value and therefore excludes U.S. import duties.
Exports are valued at the f.a.s. (free alongside ship) value of merchandise at the U.S. port of export, based on the transaction price including inland freight, insurance, and other charges incurred in placing the merchandise alongside the carrier at the U.S. port of exportation.
Revision procedure (Census basis)
Monthly revisions: Monthly data include actual month's transactions as well as a small number of transactions for previous months. Each month, the U.S. Census Bureau revises the aggregate seasonally adjusted (nominal and real, or chained-dollar) and unadjusted export, import, and trade balance figures, as well as the end-use totals for the prior month. Country detail data and commodity detail data, based on the Standard International Trade Classification (SITC) Revision 4 and the North American Industry Classification System (NAICS), are not revised monthly. The timing adjustment shown in exhibit 14 is the difference between monthly data as originally reported and as recompiled.
For May 2024, unadjusted exports of goods were revised up $0.3 billion and unadjusted imports of goods were revised down less than $0.1 billion. Goods carry-over in June 2024 was $0.2 billion (0.1 percent) for exports and less than $0.1 billion (less than 0.1 percent) for imports. For May 2024, revised export carry-over was $0.1 billion (0.1 percent) and revised import carry-over was less than $0.1 billion (less than 0.1 percent).
Quarterly revisions to chain-weighted dollar series: For March, June, September, and December statistical month releases, revisions are made to the real, or chained-dollar, series presented in exhibits 10 and 11: the previous five months are revised to incorporate the U.S. Bureau of Labor Statistics' (BLS) revisions to price indexes, which are used to produce the real series and to align Census data with data published by the U.S. Bureau of Economic Analysis (BEA) in the national income and product accounts (NIPAs).
Annual revisions: Each June, not seasonally adjusted goods data are revised to redistribute monthly data that arrived too late for inclusion in the month of transaction. In addition, revisions are made to reflect corrections received subsequent to the monthly revisions. Seasonally adjusted data are also revised to reflect recalculated seasonal and trading-day adjustments. These revisions are reflected in totals, end-use, commodity, and country summary data.
Other revisions: For December and January statistical month releases, each prior month of the most recent full year is revised so that the totals of the seasonally adjusted months equal the annual totals.
U.S./Canada data exchange and substitution
Data for U.S. exports to Canada are derived from import data compiled by Canada. The use of Canada's import data to produce U.S. export data requires several alignments in order to compare the two series.
Canadian estimates: Effective with January 2001 statistics, the current month data for exports to Canada contain an estimate for late arrivals and corrections. In the following month, this estimate is replaced, in the news release exhibits only, with the actual value of late receipts and corrections. This estimate improves the current month data for exports to Canada and treats late receipts for exports to Canada in a manner that is more consistent with the treatment of late receipts for exports to other countries.
Nonsampling errors
The goods data are a complete enumeration of documents collected by CBP and are not subject to sampling errors. Quality assurance procedures are performed at every stage of collection, processing, and tabulation. However, the data are still subject to several types of nonsampling errors. The most significant of these include reporting errors, undocumented shipments, timeliness, data capture errors, and errors in the estimation of low-valued transactions.
Reporting errors: Reporting errors are mistakes or omissions made by importers, exporters, or their agents in their import or export declarations. Most errors involve missing or invalid commodity classification codes and missing or incorrect quantities or shipping weights. They have a negligible effect on aggregate import, export, and balance of trade statistics. However, they can affect the detailed commodity statistics.
Undocumented shipments: Federal regulations require importers, exporters, or their agents to report all merchandise shipments above established exemption levels. The Census Bureau has determined that not all required documents are filed, particularly for exports.
Timeliness and data capture errors: The Census Bureau captures import and export information from administrative documents and through various automated collection programs. Documents may be lost, and data may be incorrectly keyed, coded, or recorded. Transactions may be included in a subsequent month's statistics if received late.
Low-valued transactions: The total values of transactions valued as much as or below $2,500 for exports and $2,000 ($250 for certain quota items) for imports are estimated for each country, using factors based on the ratios of low-valued shipments to individual country totals for past periods.
The Census Bureau recommends that data users incorporate this information into their analyses, as nonsampling errors could impact the conclusion drawn from the results. See "U.S. Merchandise Trade Statistics: A Quality Profile" (October 2014) for a detailed discussion of errors affecting the goods data.
Area groupings
North America: Canada, Mexico.
Dominican Republic-Central America-United States Free Trade Agreement (CAFTA-DR): Costa Rica, Dominican Republic, El Salvador, Guatemala, Honduras, Nicaragua.
Europe: Albania, Andorra, Armenia, Austria, Azerbaijan, Belarus, Belgium, Bosnia and Herzegovina, Bulgaria, Croatia, Cyprus, Czech Republic, Denmark, Estonia, Faroe Islands, Finland, France, Georgia, Germany, Gibraltar, Greece, Hungary, Iceland, Ireland, Italy, Kazakhstan, Kosovo, Kyrgyzstan, Latvia, Liechtenstein, Lithuania, Luxembourg, Malta, Moldova, Monaco, Montenegro, Netherlands, North Macedonia, Norway, Poland, Portugal, Romania, Russia, San Marino, Serbia, Slovakia, Slovenia, Spain, Svalbard-Jan Mayen Island, Sweden, Switzerland, Tajikistan, Turkey, Turkmenistan, Ukraine, United Kingdom, Uzbekistan, Vatican City.
European Union: Austria, Belgium, Bulgaria, Croatia, Cyprus, Czech Republic, Denmark, Estonia, Finland, France, Germany, Greece, Hungary, Ireland, Italy, Latvia, Lithuania, Luxembourg, Malta, Netherlands, Poland, Portugal, Romania, Slovakia, Slovenia, Spain, Sweden.
Euro Area: Austria, Belgium, Croatia, Cyprus, Estonia, Finland, France, Germany, Greece, Ireland, Italy, Latvia, Lithuania, Luxembourg, Malta, Netherlands, Portugal, Slovakia, Slovenia, Spain.
Pacific Rim: Australia, Brunei, China, Hong Kong, Indonesia, Japan, Korea (South), Macau, Malaysia, New Zealand, Papua New Guinea, Philippines, Singapore, Taiwan.
South/Central America: Anguilla, Antigua and Barbuda, Argentina, Aruba, Bahamas, Barbados, Belize, Bermuda, Bolivia, Brazil, British Virgin Islands, Cayman Islands, Chile, Colombia, Costa Rica, Cuba, Curacao, Dominica, Dominican Republic, Ecuador, El Salvador, Falkland Islands (Islas Malvinas), French Guiana, Grenada, Guadeloupe, Guatemala, Guyana, Haiti, Honduras, Jamaica, Martinique, Montserrat, Netherlands Antilles, Nicaragua, Panama, Paraguay, Peru, Sint Maarten, St. Kitts and Nevis, St. Lucia, St. Vincent and the Grenadines, Suriname, Trinidad and Tobago, Turks and Caicos Islands, Uruguay, Venezuela.
Africa: Algeria, Angola, Benin, Botswana, British Indian Ocean Territories, Burkina Faso, Burundi, Cabo Verde, Cameroon, Central African Republic, Chad, Comoros, Congo (Brazzaville), Congo (Kinshasa), Djibouti, Egypt, Equatorial Guinea, Eritrea, Eswatini, Ethiopia, French Southern and Antarctic Lands, Gabon, Gambia, Ghana, Guinea, Guinea-Bissau, Ivory Coast, Kenya, Lesotho, Liberia, Libya, Madagascar, Malawi, Mali, Mauritania, Mauritius, Mayotte, Morocco, Mozambique, Namibia, Niger, Nigeria, Reunion, Rwanda, St. Helena, Sao Tome and Principe, Senegal, Seychelles, Sierra Leone, Somalia, South Africa, South Sudan, Sudan, Tanzania, Togo, Tunisia, Uganda, Zambia, Zimbabwe.
Adjustments for seasonal and trading-day variations
Goods are initially classified under the Harmonized Commodity Description and Coding System (Harmonized System), which is an internationally accepted standard for the commodity classification of traded goods. The Harmonized System describes and measures the characteristics of the goods and is the basis for the systems used in the United States: Schedule B for exports and Harmonized Tariff Schedule for imports. Combining trade into approximately 140 export and 140 import end-use categories makes it possible to examine goods according to their principal uses (see exhibits 7 and 8). These categories are used as the basis for computing the seasonal and trading-day adjusted data. These adjusted data are then summed to the six end-use aggregates for publication (see exhibit 6). The Census Bureau provides these data to BEA for use in the NIPAs and in the U.S international transactions accounts (balance of payments accounts).
Exhibit 19 shows goods (Census basis) that are seasonally adjusted for selected countries and world areas. Unlike the commodity-based adjustments discussed above, these adjustments are developed and applied directly at the country and world area levels. For total exports and imports, data users should refer to the commodity-based totals shown in the other exhibits. The seasonally adjusted country and world area data will not sum to the seasonally adjusted commodity-based totals because the seasonally adjusted country and world area data and the commodity-based totals are derived from different aggregations of the export and import data and from different seasonal adjustment models. Data users should use caution drawing comparisons between the two sets of seasonally adjusted series.
The seasonal adjustment procedure (X-13ARIMA-SEATS) is based on a model that estimates the monthly movements as percentages above or below the general level of series (unlike other methods that redistribute the actual series values over the calendar year). Because the data series for aircraft is highly variable, users studying data trends may wish to analyze trade in aircraft separately from other trade.
Adjustments for price change
Data adjusted for seasonal variation on a real, or chained-dollar, basis (2017 reference year) are presented in exhibits 10 and 11. This adjustment for price change is done using the Fisher chain-weighted methodology. The deflators are primarily based on the monthly price indexes published by the BLS using techniques developed for the NIPAs by BEA.
Principal commodities
Goods data appearing in exhibit 15 are classified in terms of the SITC Revision 4, with the exception of agricultural and manufactured goods. Agricultural goods are defined by the U.S. Department of Agriculture (USDA) based on World Trade Organization guidance; they consist of non-fishery food products, raw fibers, feeds, and derivatives. Manufactured goods conform to the NAICS; they consist of goods that have been mechanically, physically, or chemically transformed. USDA agricultural goods and NAICS manufactured goods are not mutually exclusive categories.
Re-exports are foreign merchandise entering the country as imports and then exported in substantially the same condition as when imported. Re-exports, which are included in overall export totals, appear as separate line items in exhibit 15.
Advanced technology products
About 500 of some 22,000 Schedule B and Harmonized Tariff Schedule classification codes used in reporting U.S. merchandise trade are identified as "advanced technology" codes, and they meet the following criteria:
The aggregation of the goods results in a measure of advanced technology trade that appears in exhibits 16 and 16a. This product- and commodity-based measure of advanced technology differs from broader NAICS-based measures, which include all goods produced by a particular industry group, regardless of the level of technology embodied in the goods.
Goods trade in the Advance Economic Indicators Report
In addition to the U.S. International Trade in Goods and Services report (FT-900), which is released jointly with BEA, the Census Bureau also releases advance statistics on international trade in goods, along with advance estimates on retail and wholesale inventories, in the Advance Economic Indicators Report (Advance Report). Trade statistics in the Advance Report, released on average 24 to 26 calendar days after the end of the reference month, reflect nearly complete coverage of goods trade, while statistics in the FT-900, released on average 34 to 36 calendar days after the end of the reference month, reflect complete coverage.
The Advance Report contains advance statistics for goods trade on a Census basis by principal end-use category, thus providing users an earlier high-level snapshot of U.S. international trade for the featured month. Commodity and country details and statistics for goods trade on a balance of payments (BOP) basis and for services trade are released several days later in the FT-900. See the Advance Report Frequently Asked Questions for more information.
The FT-900 is the primary source for the goods trade data used in BEA's quarterly gross domestic product (GDP) statistics. However, for the advance GDP estimate, FT-900 data for the third month are not yet available, so BEA uses data from the Advance Report. Because only goods trade on a Census basis by principal end-use category is available in the Advance Report, BEA applies adjustments, such as BOP and coverage adjustments, to the Advance Report statistics to produce detailed estimates for incorporation into the advance GDP estimate. See the "Key Source Data and Assumptions" table that accompanies each GDP release for more information.
Goods (BOP basis) and services
Quarterly and annual statistics for goods on a BOP basis and for services are included in the U.S. international transactions accounts (ITAs), which are published by BEA in news releases in March, June, September, and December and in the Survey of Current Business in January, April, July, and October. The next release of the ITAs is scheduled for September 19, 2024.
In addition, BEA releases detailed monthly and quarterly goods statistics, which consist of statistics on trade in goods by end-use category and commodity on both a Census basis and a BOP basis, and detailed annual services statistics, which consist of statistics on trade in services and on services supplied through affiliates of multinational enterprises. The services statistics provide detail on U.S. trade in services by type and by country and area and detail on services supplied through affiliates by industry and by country and area.
Goods (BOP basis)
Goods on a Census basis are adjusted by BEA to a BOP basis to align the data with the concepts and definitions used to prepare the international and national economic accounts. These adjustments, which are applied separately to exports and imports, are necessary to supplement coverage of the Census data, to eliminate duplication of transactions recorded elsewhere in the international accounts, and to value transactions at market prices. They include both additions to and deductions from goods on a Census basis and are presented in this release as net adjustments. Adjustments that exhibit significant seasonal patterns are seasonally adjusted. BEA also publishes more detailed quarterly and annual statistics for net adjustments in ITA Table 2.4. U.S. International Trade in Goods, Balance of Payments Adjustments.
The export adjustments include:
Gold exports, nonmonetary - This addition is made for gold that is purchased by foreign official agencies from private dealers in the United States and held at the Federal Reserve Bank of New York. The Census data only include gold that leaves the U.S. customs territory.
Goods procured in U.S. ports by foreign carriers - This addition is made for foreign air and ocean carriers' fuel purchases in U.S. ports.
Net exports of goods under merchanting - This addition is made to include the net value of the purchase and subsequent resale of goods abroad without the goods entering the United States. Because these goods do not cross the U.S. customs frontier, their value is not recorded in the Census data.
Other adjustments to exports include:
Deductions for equipment repairs (parts and labor), developed motion picture film, military grant-aid, and, for periods prior to 2010, goods identified in the Census data as exports under the Foreign Military Sales (FMS) program. Additions for sales of fish caught in U.S. territorial waters, exports of electric energy to Mexico, private gift parcels, military goods transferred through grants, vessels and oil rigs for which ownership changes, valuation of software exports at market value, low-value (below reporting threshold) transactions for 1999–2009 to phase in a revised Census Bureau low-value methodology that was implemented for goods on a Census basis beginning with statistics for 2010, and, for periods prior to 2010, FMS goods exports reported to BEA by the U.S. Department of Defense.
The import adjustments include:
Gold imports, nonmonetary - This addition is made for gold sold by foreign official agencies to private purchasers out of stock held at the Federal Reserve Bank of New York. The Census data only include gold that enters the U.S. customs territory.
Goods procured in foreign ports by U.S. carriers - This addition is made for U.S. air and ocean carriers' fuel purchases in foreign ports.
Imports by U.S. military agencies - This addition is made for purchases of goods abroad by U.S. military agencies, which are reported to BEA by the Department of Defense. The Census data only include imports of goods by U.S. military agencies that enter the U.S. customs territory.
Inland freight in Canada and Mexico - This addition is made for inland freight in Canada and Mexico. Imports of goods from all countries should be valued at the customs value—the value at the foreign port of export including inland freight charges. For imports from Canada and Mexico, this should be the cost of the goods at the U.S. border. However, the customs value for imports for certain Canadian and Mexican goods is the point of origin in Canada or Mexico. BEA makes an addition for the inland freight charges of transporting these goods to the U.S. border to make the value comparable to the customs value reported for imports from other countries.
Other adjustments to imports include:
Deductions for equipment repairs (parts and labor), repairs to U.S. vessels abroad, and developed motion picture film. Additions for non-reported imports of locomotives and railcars from Canada and Mexico, non-reported imports of aircraft, imports of electric energy from Mexico, conversion of vessels for commercial use, valuation of software imports at market value, and low-value (below reporting threshold) transactions for 1999–2009 to phase in a revised Census Bureau low-value methodology that was implemented for goods on a Census basis beginning with statistics for 2010.
Services
The services statistics cover transactions between foreign countries and the 50 states, the District of Columbia, Puerto Rico, the U.S. Virgin Islands, and other U.S. territories and possessions. Transactions with U.S. military, diplomatic, and consular installations abroad are excluded because these installations are considered to be part of the U.S. economy.
Services statistics are based on quarterly, annual, and benchmark surveys and information obtained from monthly government and private sector reports. For categories for which monthly data are not available, monthly statistics are derived from quarterly statistics through temporal distribution, or interpolation. The interpolation methodology used by BEA is the modified Denton proportional first difference method. This method preserves the pattern of the monthly indicator series, if available, while satisfying the annual aggregation constraints. See "An Empirical Review of Methods for Temporal Distribution and Interpolation in the National Accounts" (May 2008) for more information. Services are seasonally adjusted when statistically significant seasonal patterns are present.
Services are shown in eleven broad categories. The following is a brief description of the types of services included in each category:
Maintenance and repair services n.i.e. (not included elsewhere) - Consists of maintenance and repair services performed by residents of one country on goods that are owned by residents of another country. The repairs may be performed at the site of the repair facility or elsewhere. Excludes such services in which the cost is included in the price of the goods and is not billed separately or is declared as a part of the price of the goods on the import or export declaration filed with U.S. Customs and Border Protection. Maintenance and repair of computers are included under computer services, and some maintenance and repair of ships, aircraft, and other transport equipment are included under transport. Construction maintenance and repair are included under construction.
Transport - Consists of transactions associated with moving people and freight from one location to another and includes related supporting and auxiliary services. Transport covers all modes of transportation, including air, sea, rail, road, space, and pipeline. Postal and courier services and port services, which cover cargo handling, storage and warehousing, and other related transport services, are also included.
Travel (for all purposes including education) - Includes goods and services acquired by nonresidents while abroad. A traveler is defined as a person who stays, or intends to stay, for less than one year in a country of which he or she is not a resident or as a nonresident whose purpose is to obtain education or medical treatment, no matter how long the stay. Purchases can be either for own use or for gifts to others. Travel is a transactor-based component that covers a variety of goods and services, primarily lodging, meals, transportation in the country of travel, amusement, entertainment, and gifts. Travel excludes air passenger services for travel between countries, which are included in transport, and goods for resale, which are included in goods.
Travel includes business and personal travel. Business travel covers goods and services acquired for use by persons whose primary purpose for travel is for business (including goods and services for which business travelers are reimbursed by employers). Business travel also includes expenditures by border, seasonal, and other short-term workers in their economy of employment. Personal travel covers travel for all non-business purposes, including for medical or educational purposes.
Construction - Consists of the services provided to create, renovate, repair, or extend buildings, land improvements, and civil engineering constructions, such as roads and bridges. Additionally, in concept, inputs purchased by foreign construction contractors for projects in the United States are included in construction exports, and inputs purchased abroad by U.S. construction contractors are included in construction imports. However, in practice, data are not available to estimate inputs purchased by foreign contractors for projects in the United States, so BEA statistics on construction exports do not include this component.
Insurance services - Includes the direct insurance services of providing life insurance and annuities, non-life (property and casualty) insurance, reinsurance, freight insurance, and auxiliary insurance services. Insurance is measured as gross premiums earned plus premium supplements less claims payable, with an adjustment for claims volatility. Premium supplements represent investment income from insurance reserves, which are attributed to policyholders who are treated as paying the income back to the insurer. Auxiliary insurance services include agents' commissions, brokerage services, insurance consulting services, actuarial services, and other insurance services.
Financial services - Includes financial intermediary and auxiliary services, except insurance services. These services include those normally provided by banks and other financial institutions, such as securities brokerage and underwriting, financial management, financial advisory, and custody services; credit card and other credit-related services; and securities lending, electronic funds transfer, and other services. Financial services include services for which an explicit commission or fee is charged as well as implicit charges, such as (1) implicit fees for bond transactions, measured as the difference between bid and ask prices; (2) margins on buying and selling transactions (called market-making services); and (3) margins between interest payable and the reference rate on loans and deposits (called financial intermediation service charges indirectly measured, abbreviated as FISIM).
Charges for the use of intellectual property n.i.e. - Includes (1) charges for the use of proprietary rights, such as patents, trademarks, copyrights, and franchises, and (2) charges for licenses to reproduce and/or distribute intellectual property embodied in produced originals (such as copyrights on books and manuscripts, computer software, cinematographic works, and sound recordings) and related rights (such as for live performances and television, cable, or satellite broadcast). Charges for end-user rights to use general-use computer software and outright sales of customized computer software are included under computer services. Charges for end-user rights to use audiovisual content, such as film, television programming, and sound recordings, as well as outright sales of audiovisual originals, are included under audiovisual services, a component of personal, cultural, and recreational services.
Telecommunications, computer, and information services - Telecommunications services include the broadcast or transmission of sound, images, data, or other information by electronic means. These services do not include the value of the information transmitted. Computer services consist of hardware- and software-related services and data processing services. Sales of customized software and related use licenses, as well as licenses to use non-customized software with a periodic license fee, are also included, as is software downloaded or otherwise electronically delivered. Cross-border transactions in non-customized packaged software with a license for perpetual use are included in goods. Information services include news agency services, database services, and web search portals.
Other business services - Consists of research and development services, professional and management consulting services, and technical, trade-related, and other business services. Research and development services include services associated with basic and applied research and experimental development of new products and processes as well as outright sales of the outcomes of research and development (such as patents, copyrights, and information about industrial processes). Professional and management consulting services include legal services, accounting, management consulting, managerial services, public relations services, advertising, and market research. Amounts received by a parent company from its affiliates for general overhead expenses related to these services are included. Technical, trade-related, and other business services include architectural and engineering, waste treatment, operational leasing, trade-related, and other business services.
Personal, cultural, and recreational services - Consists of the following three subcategories: (1) audiovisual services, which covers production of audiovisual content, end-user rights to use audiovisual content, and outright sales and purchases of audiovisual originals; (2) artistic-related services, which includes the services provided by performing artists, authors, composers, and other visual artists; set, costume, and lighting design; presentation and promotion of performing arts and other live entertainment events; and fees to artists and athletes for performances, sporting events, and similar events; and (3) other personal, cultural, and recreational services, which includes services such as education services delivered online, remotely provided telemedicine services, and services associated with museum and other cultural, sporting gambling, and recreational activities, except those acquired by customers traveling outside their country of residence.
Government goods and services n.i.e. - Includes goods and services supplied by and to enclaves, such as embassies, military bases, and international organizations; goods and services acquired from the host economy by diplomats, consular staff, and military personnel located abroad and their dependents; and goods and services supplied by and to governments that are not included in other goods and services categories. Goods and services supplied by and to governments are classified to specific goods and services categories when source data permit.
Goods (BOP basis) and services by country and area
Monthly country and area detail is not available for goods on a BOP basis or for services. However, quarterly statistics on goods on a BOP basis and on services that are seasonally adjusted by geography are shown in exhibit 20. Unlike the seasonal adjustments by commodity and by service type that are applied to the global totals, these adjustments are developed and applied directly at the country and world area levels. For total exports and imports, data users should refer to the by-commodity and by-service type totals shown in the other exhibits. The seasonally adjusted country and world area data will not sum to the seasonally adjusted by-commodity and by-service type totals because the two sets of statistics are derived from different aggregations of the export and import data and from different seasonal adjustment models. Data users should use caution drawing comparisons between the two sets of seasonally adjusted series.
The definitions of the world areas shown in exhibit 20 are consistent with the definitions for goods on a Census basis (see Area groupings above) with a few exceptions. For services, CAFTA-DR is not available because trade with this area currently is not reviewed for seasonality. For goods on a BOP basis and for services, European Union reflects the composition of the areas at the time of reporting.
Revision procedure (goods on a BOP basis and services)
Monthly revisions: Each month, a preliminary estimate for the current month and a revised estimate for the immediately preceding month are released. After the initial revision, no further revisions are made to a month until more complete source data become available in March, June, September, and December.
Quarterly revisions: The releases in March, June, September, and December contain revised estimates for the previous six months to incorporate more comprehensive and updated source data.
Annual revisions: Each June, historical data are revised to incorporate newly available and revised source data, changes in definitions and classifications, and changes in estimation methods. Seasonally adjusted data are also revised to reflect recalculated seasonal and trading-day adjustments.
Other revisions: The release for December statistical month contains revisions to goods for January through November of the most recent year; the release for January statistical month contains revisions to both goods and services for all months of the most recent year. These revisions result from forcing the seasonally adjusted months to equal the annual totals.
Data availability
Resources
Census Bureau's application programming interface (API): The Census Bureau's API, available at www.census.gov/developers, lets developers create custom apps to reach new users and makes key demographic, socio-economic, and housing statistics more accessible than ever before.
BEA's data API: BEA's data API, available at apps.bea.gov/API/signup/, provides programmatic access to BEA's published economic statistics using industry-standard methods and procedures.